
Given that our business model is all about delivering value to our clients through improvements in asset management, maintenance management and reliability engineering, it is not surprising that we are often asked how best to put a value on maintenance and reliability improvements project.
The answer of course is ‘that depends on the nature of the project’.
In this article, we will consider the three levers of value in any maintenance and reliability improvement project, explore five approaches that we commonly apply to estimate the likely value from the improvement projects, and discuss methods for measuring and monitoring whether the project is actually delivering on its promise.
The three levers of value
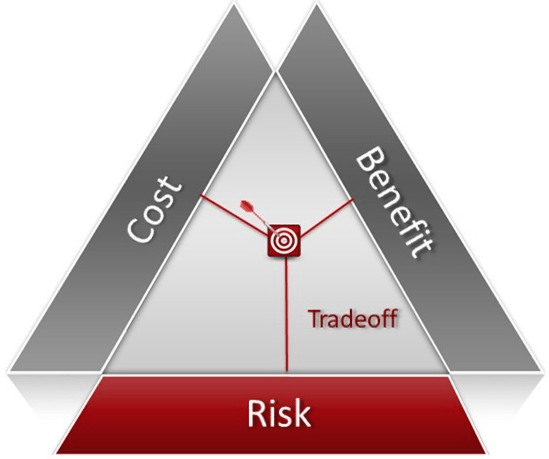
Broadly speaking, there are three levers that can be pulled to deliver value from a maintenance or reliability improvement project.
The first two of these – Benefit and Cost – typically come as no surprise, but the third lever, Risk, is often overlooked. Let’s consider each.
Benefits are typically realised through the reduction or elimination of production delays, rate losses, or improvements in quality.
From a maintenance and reliability perspective, the obvious contributors to production delays include the amount of planned and unplanned maintenance, and typical improvement initiatives include reducing shutdown durations, more efficiently executing planned maintenance, or focusing on equipment availability.
Rate losses can similarly be associated with things like ramp-up after shutdowns and start-up losses after unplanned events. Again, improvement initiatives often focus on efficient maintenance execution and improving mean time to failure through reliability improvement.
Quality losses are more often associated with maintenance tactics that are not aligned to the operating context of the equipment.
Costs are typically reduced by focusing on the internal efficiency of the maintenance and reliability teams. Improvement programs focussed on better planning and scheduling, improvements in tool-time or reductions in contractor numbers are a few common projects that we see. But there are many other targets areas for cost improvement and we will discuss these below.
While the ratio of fixed costs, operating costs, maintenance costs, and sales margin vary significantly from industry to industry, and between businesses within an industry, it is fair to say that a small percentage improvement in production volumes typically outweighs a similar percentage improvement in maintenance costs by an order of magnitude. In one of our recent studies focused on reliability and maintenance improvement for a mining client, we found that the benefits of a reliability improvement program resulted in a $4m per annum reduction in maintenance costs, while delivering nearly $120m per annum in addition production.
So, the moral here is that if the business in not market constrained, then focussing on the Benefit side of the equation is likely to deliver substantially more value than focussing on Costs.
But what about our third value lever – Risk. If you think about cost reduction as focussing on minimising expected costs, then focussing on Risk is about minimising unexpected costs. Think about a typical risk management process. The risk is identified and a likelihood and consequence established. If the unmitigated risk is not tolerable, then a mitigation is put in place to reduce the risk to a tolerable level. Now flip that on its head. If the mitigation is not put in place, is there any guarantee the risk event would occur? No! But is there a value in having the mitigation in place anyway? You bet, because it avoids the consequences (and costs) associated with the event should it occur.
An example of this is a condition monitoring program – we monitor asset condition to detect imminent failure and avoid catastrophic loss. If we haven’t had a catastrophic failure since the program commenced, should we stop our condition monitoring program because it is an unnecessary cost? Or is the program actually achieving its desired outcome, namely preventing unexpected costs hitting the bottom line and hence actually delivering value?
Value estimation
So, if Benefit, Cost and Risk are the three levers that we can pull, how do we estimate the value associated with a specific maintenance and/or reliability improvement project? It turns out there are five approaches that are commonly applied. We have broken these into top down and bottom up approaches.
Top down approaches are typically used to develop ‘order of magnitude’ estimates of value potential, and are usually associated with cost reduction programs – these include Estimated Replacement Value and Maintenance Cost Indexing.
The bottom up approaches aim to identify and value more targeted improvement opportunities that result from improving uptime, reducing cost or mitigating risk – these include Loss and Delay Analysis, Cost Driver Tree Analysis, and Risk Analysis.
Estimated replacement value
We have included Estimated Replacement Value (ERV) as a value estimation tool not because we are great fans, but because we have seen this approach ‘applied’ to various clients and believe it is fraught.
The theory is that there is a direct correlation between maintenance spend and the estimated replacement value of the a sset being maintained. A commonly used benchmark is that maintenance spend should be in the vicinity of 2 – 3% of ERV. In reality, this spend can vary widely.
One need not look further than the family car, used within its normal operating context to commute to and from work, the occasional road trip etc, it may accumulate say 20,000km per annum. Now take that exact same car and put it to work as a taxi running perhaps 90,000km per annum. Is the annual maintenance cost as a percentage of replacement cost likely to be equivalent? No!
In one case study in mining, a better practice operator was found to have maintenance cost in the order of 18 – 36% of ERV, bearing witness to the vagaries of ERV as a useful determinant of maintenance potential.
Maintenance cost indexing
Maintenance cost indexing is another top down approach to determine the likely benefits of a maintenance improvement program where that program is focussed on maintenance tactics and/or planning and scheduling optimisation.
It categorises maintenance as planned maintenance, unplanned maintenance and breakdown maintenance and assumes that a breakdown event is costlier than an unplanned event, which in turn is costlier than a breakdown event.
The most common range of ratios used for maintenance cost indexing is shown below:
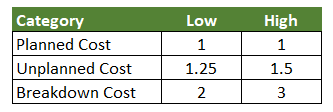
By considering the current distribution of maintenance activity, and the desired future distribution and applying the above ratios, one can determine the magnitude of the likely improvement opportunity. Then by multiplying this by current maintenance spend, one can arrive at an improvement value.
Consider the following example where maintenance today is 40% planned, 25% unplanned and 35% breakdown, and the expectation is that the business could move to 60% planned, 30% unplanned, and 10% breakdown. Assuming that breakdowns are double the cost of a properly planned maintenance intervention, and that an unplanned event is 25% more expensive, then the improvement potential is a 17% reduction in maintenance spend.
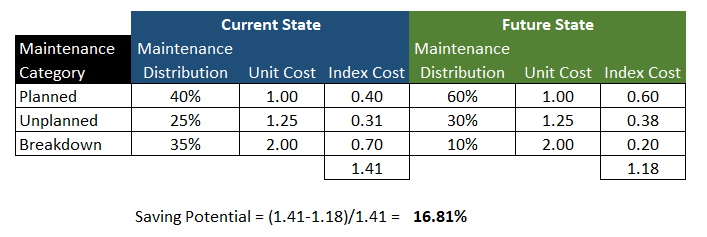
Again, this is a top down estimation, and contains many assumptions, but it provides an order of magnitude estimate of savings potential.
Loss and delay analysis
Loss and Delay analysis is the first of our bottom up approaches. Rather than focussing on cost it focuses instead on benefits – namely the upside potential of production improvement. This typically begins with a review of plant delay and loss data which is often characterised as a waterfall chart as shown below.
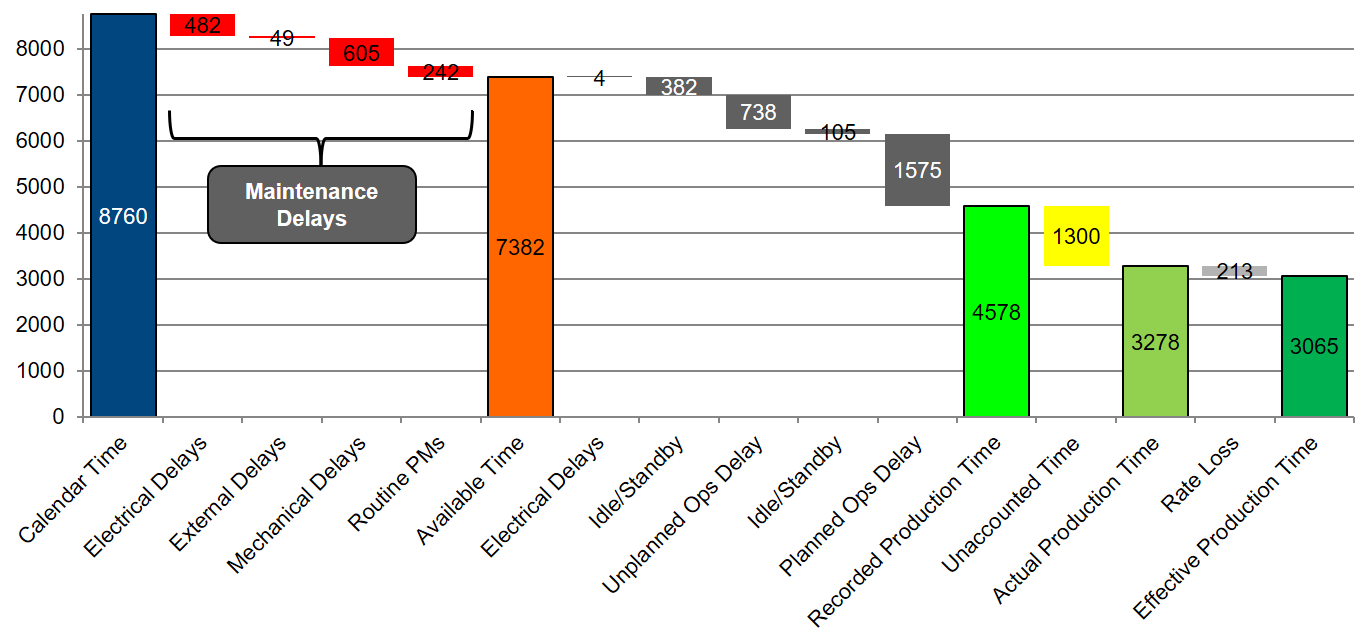
In this particular example, maintenance losses account for around 60 lost days of production per year. Some of this is necessary in this case such as routine PMs, but some is potentially avoidable.
The analysis may stop here and assume that a certain percentage of potentially avoidable delays could actually be eliminated. So, of the 1000 hours of lost production due to mechanical and electrical delays perhaps 10% could be avoided, therefore approximately 4 additional days of production per annum.
Or the analysis could unpack the data further by developing a pareto chart of problematic equipment, or common delays across the plant as shown below, to better understand the extent of avoidable losses.
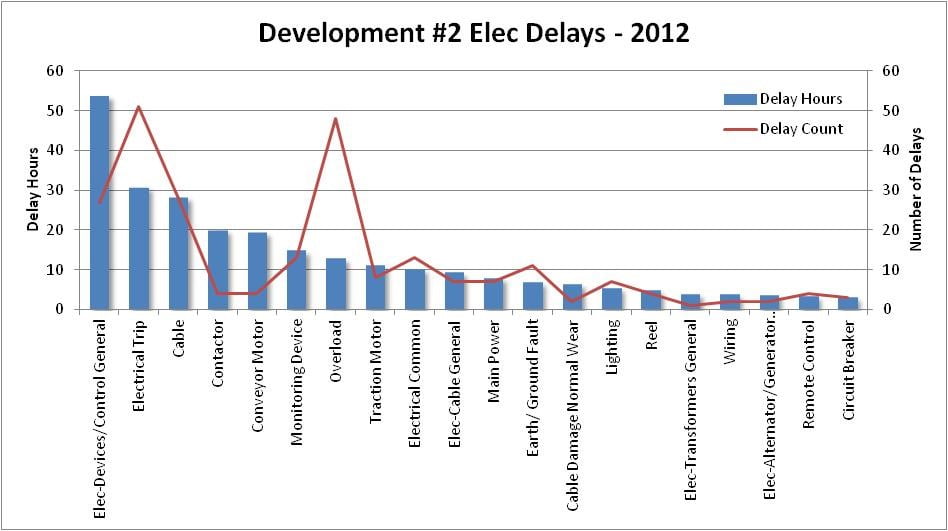
Again, the analysis may stop at this point, or the data can be unpacked further by drilling into work orders to identify avoidable losses at a work order level.
No matter what level the data in unpacked to, the analysis is about determining the production upside through eliminating maintenance waste. This upside can only be realised when the business is unconstrained by upstream processes or ultimately the market i.e. each additional unit of production can actually be sold.
Cost driver tree analysis
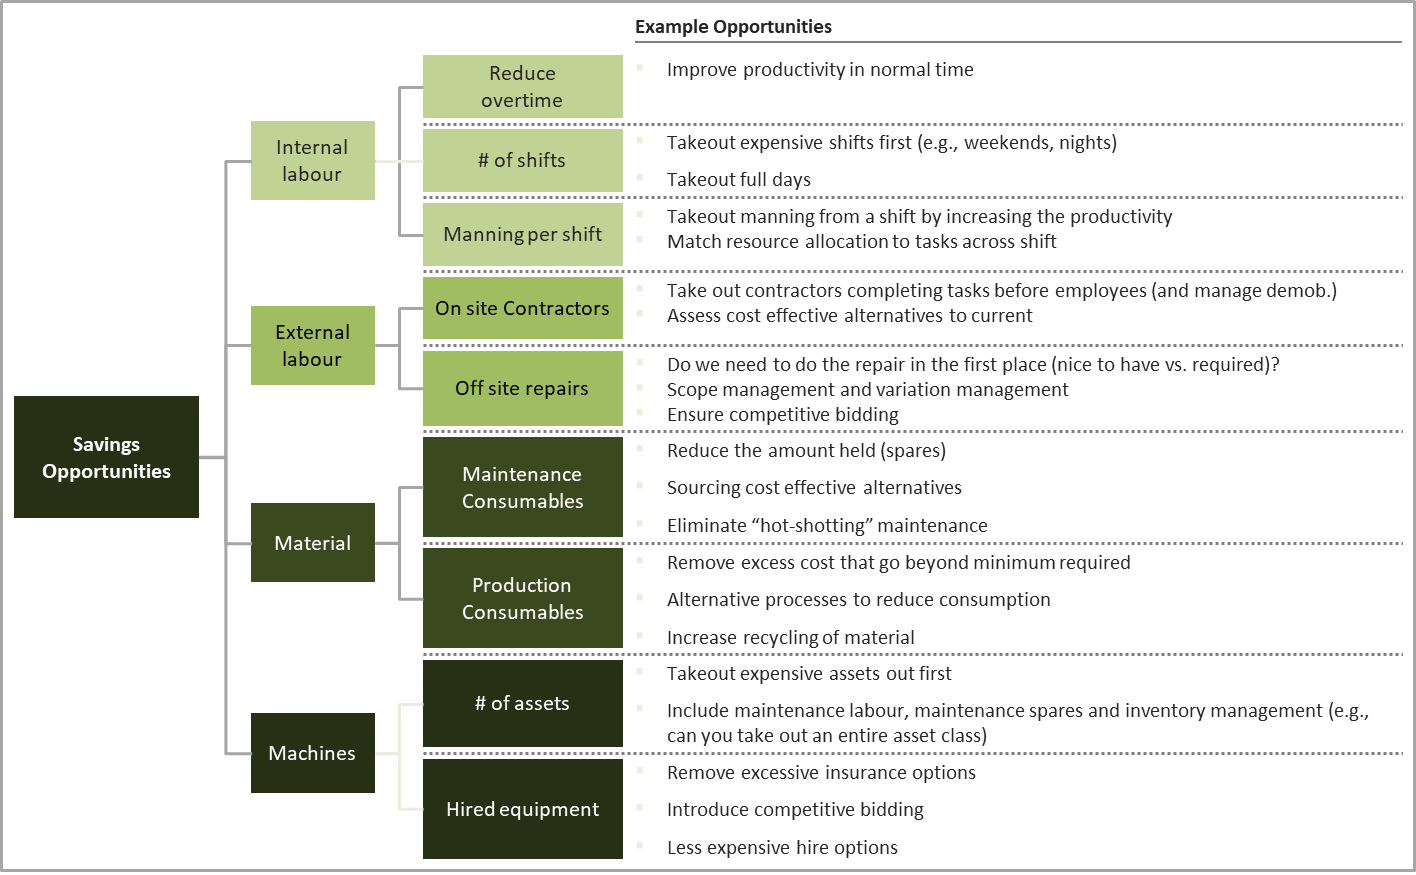
Another popular bottom up approach for determining improvement benefits is the cost driver tree approach. This approach categorises maintenance costs using a cost driver tree as shown below and then uses a workshop approach to unpack the likely savings in each category to arrive at the value potential for a particular program. Of course, the value driver tree needs to be tailored to the improvement initiative and the model below will not be applicable in all circumstances.
Risk analysis
The final approach discussed here relates to determining the value of an improvement program targeting risk. Given that we are dealing with losses that may occur rather than losses that have occurred, the fundamental difference is that probability of loss plays into the calculation.
Typically approaches such as Failure Mode and Effect Analysis (FMEA) which is discussed in our article Four Essential Tools and Techniques for Improving Equipment Reliability or Risk Analysis, covered in Maintenance – Risky Business? are used to identify potential sources of loss. The consequences of the loss can be converted to a business impact in dollars, and then a probability is applied to cater for the probability of the event occurring in the budget period being considered for the value calculation.
For example, to estimate the value of a condition monitoring program, the first step is to understand the failure modes that the program is intended to address, the likelihood and consequence of those failures occurring if there is no condition monitoring program in place, the extent to which the condition monitoring program will mitigate the consequences of failure. This data can then be used to estimate the benefit of the program which can be compared to the cost of the program to evaluate whether it is worth running.
Measuring value delivery
While it is important to have a realistic estimate of the value potential of a maintenance or reliability improvement project to ensure that it is worth doing, it is even more important to ensure that the project delivers the expected benefits once implemented.
There is an entire discipline around benefits realisation that is beyond this article, but we wanted to highlight a few traps that you might want to consider up front. Namely the importance of setting a realistic baseline against which to measure improvement, isolating the noise of other improvements, and not locking into the ‘show me the money’ mindset.
Establishing a realistic baseline
All too often we see ‘budget’ used as the baseline for measuring value delivery. In our experience, many businesses fail to hit budget year on year, and hence using budget as a baseline is meaningless. Furthermore, even in businesses with a solid track record of delivering to plan, the budget may have already factored in the improvement being considered, it is commonplace for budgets to include aspirational components such as ‘continuous improvement’ or ‘cost efficiency’ with no clear path to delivery of those elements.
A more robust approach is to use an improvement baseline based on demonstrated or actual performance. While there are no hard and fast rules for the period to be considered, a reasonable starting place is the last 12 months performance unless there has been a radical change in a physical factor underlying cost performance in that period.
We always recommend a backward-looking baseline, rather than assuming the budget reflects a realistic level of performance.
Isolate the noise
Another important consideration in establishing the baseline is how to isolate the impact of other factors on value delivery.
For example, some businesses choose to measure the unit cost of maintenance, that is maintenance costs divided by production volume. This is a great measure as it considers cost reductions, and the impact of uptime improvements all in the one measure. However, there are many other factors that might contribute to the improved volumes such as production efficiencies, improvements in process chemistry, plant configuration changes, market demand etc. It is therefore important to consider the nature of the improvement project and ensure that the value directly attributed to that improvement can be isolated for measurement.
Consider proxy measures
In some cases, it is not possible to measure the improvement simply by watching for dollars to flow to the bottom line. For example, if the objective is to increase plant utilisation by introducing an extra production shift, but plant availability needs to be improved by 5% before the step change in utilisation can be realised, then the value of availability improvement will not be seen on the bottom line until it hits 5% and the addition shift is introduced.
So, in this case dollars are not a great measure.
But availability is and given that the business case defines the value of a 5% availability improvement, we can calculate the value of an incremental improvement as we work toward the target. We call this a proxy measure. The beauty of proxy measures is that they can be fine-tuned to the improvement program at hand, are not pegged to value on the bottom line, and are therefore an effective tool for isolating the noise of other improvements.
Conclusion
This article has described the three value levers that are impacted by maintenance and reliability improvement programs – two obvious levers, Benefits and Costs; and one less obvious lever, Risk.
It has also described two top down, and three bottom-up approaches to estimate the value likely to be derived from a maintenance and reliability improvement project and finally highlighted three key considerations to be taken into account when measuring whether value is actually being delivered.
Our next article in this series will consider value in the context of asset management and explore concepts around value over the asset lifecycle.
If you would like to receive early notification of publication of future articles, sign up for our newsletter now. In the meantime, if you would like assistance in development of a business case for your project, please contact us.