For Senior Executives to incorporate Reliability Improvement as a core element of their strategic plan, there must be a sound business case. Let’s examine how you might estimate the costs and benefits associated with a Reliability Improvement program.
This is the second in a series of 6 articles on moving from a repair-focused to a reliability-focused culture.
Articles in this series
Estimating the costs of the program
The cost of the program will very strongly depend on how well your current processes, practices, documentation and systems align with good reliability practices. For that reason, we strongly recommend that any organisation considering a Reliability Improvement program first perform a gap analysis against good practice. While this can be done using internal resources, this will often lack credibility at senior executive level, and so we recommend engaging external consultants to perform this gap assessment. This is a service that we provide, and we have performed more than 70 such gap assessments across a wide range of industries. Contact us if you would like more information.
Once you have identified the gaps that exist, you will need to develop an improvement roadmap which can then be used to develop a fully costed implementation plan. The costs may include an allowance for the cost of internal labour, as well as any external consultants or contractors that may need to be engaged. Once again, we can assist in this area if you feel that you do not have the required competence or experience internally to develop these plans.
Estimating the benefits of the program
This is likely to be a more difficult exercise than estimating the costs. Nevertheless, it needs to be done. The benefits may be both quantitative and able to be expressed in financial terms or may be more qualitative or unable to be expressed in financial terms. In this section we will discuss the quantitative, financial benefits. The benefits of improved Reliability include such elements as:
- Increased Production Output
- Reduced Operating Costs
- Reduced Maintenance Costs
- Deferred Capital Expenditure
- Reduced Working Capital Requirements
- Increased Product/Service Quality
- Reduced Scrap/Waste
However you will need to estimate how much improvement there will be in these elements and convert this into financial terms. So you will need to consider such questions as:
- How much is 1% extra production output worth to your organisation?
- How much will reducing maintenance costs by 1% save (and will there be any increase in risks as a result)?
- What is the $ value of improving product or service quality?
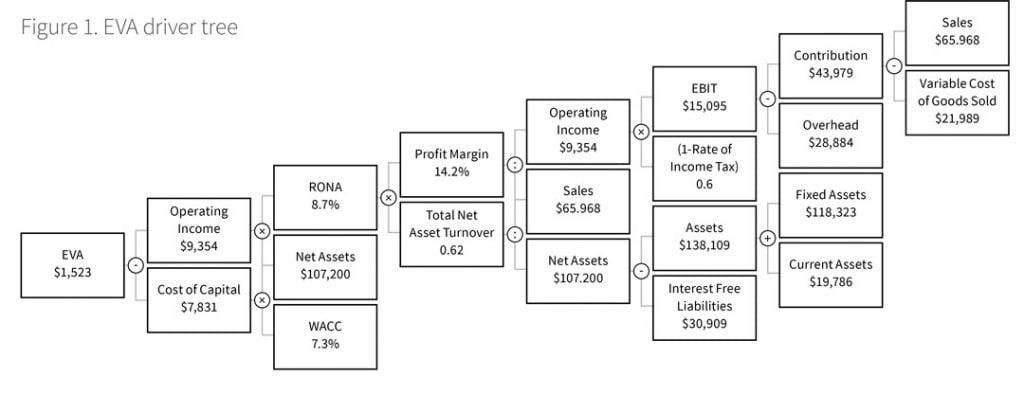
One model that can assist in performing this evaluation (at least for “for profit” organisations) is the Economic Value Add driver tree. Explaining how this works in detail is beyond the scope of this paper, but more information can be found online at various places, including valq.com/blogs/value-driver-tree-introduction-101/.
Essentially Economic Value Add (EVA) is a measure of the value of an organisation. It can be calculated by breaking it down into various subcomponents and then adding, subtracting or dividing these components by each other in order to derive the EVA. A sample of an EVA driver tree is illustrated in Figure 1.

Using this EVA driver tree it is possible to calculate the impact on EVA of changes to several factors, such as:
- Increased Sales
- Reductions in Costs
- Reductions in Fixed Asset Values
- Reductions in Working Capital/Current Assets
All of these changes will drive up EVA, but by differing amounts, depending on the specific organisation. This can then be used as a guide to identify the priority areas where improvements will provide the greatest overall financial benefit to the organisation.
If you would like assistance to develop an EVA Driver tree for your organization, once again, contact us. If you are looking for further tips to shift your organisation from a reactive to proactive culture, the other articles in this series may be able to help:
Articles in this series
